Semi-Log Graph
somerandomathblog
Sunday, March 12, 2017
Semi-Log Graphs
Recently I was introduced to a concept of graphing called semi-log graphing. When most people use graphs, they use linear scales for both the x and y axes, but semi-log graphs use a linear scale for the x axis and a logarithmic scale for the y axis, hence semi-log. How this logarithmic scale works is it goes up from numbers one-ten, then continues as such but with the numbers ten-twenty. Essentially, you ad a zero after the numbers of the scale every ten numbers. This logarithmic scale is very useful for looking at certain functions, like exponential functions. Below are graphs of the functions f(x) = 2^x and g(x) = 3^x on both a semi-log graph and standard graph. You can see the values are much clearer on a semi-log graph, but it can be difficult to recognize the function without understanding the semi-log format.
Wednesday, March 1, 2017
Exponential Functions
Exponential functions are an interesting concept that can be used to describe extreme growth of things and numbers. Whet graphing an exponential function it loos like this: y = n ^ x. This means that every y value is a number and the x value as its exponent. Imagine this; on the internet, somebody posts some information. In the next hour (the internet is very slow today) three people see this information, and in the next hour they each share it with three people, and so on. The numbers of people who see the information greatly increases each hour. By hour fifteen, over ten-million people have seen the information. Now imagine if ten people shared this information every hour (the internet is slightly less broken). graph of this information on very low levels can be seen below. If everyone could and wanted too, all the people in the world could see the information in less than a day with both these functions. And remember, this is some people sharing every hour, when really information can now be shared every couple seconds. Imagine what would happen if 100 people shared every fifteen seconds? No, the internet needs longer to repair, so thirty seconds. It would take five minutes for more people than those that exist to see the information.
Here you see both these functions, and the points that correspond to the natural numbers that allow visibility. The black line (No, not the y -axis) represents y = 10^ x, and the red line represents y = 3 ^ x. (1, 10) and (2, 100) are the points that represent the black line function. Even at this beginning scale, you can see how quickly the function rises.
Friday, February 17, 2017
Pascal's Triangle
Pascal's triangle is a very interesting piece of mathematics named for French mathematician Blaise Pascal, although this triangle was being studied centuries before him in China, India, Persia, Germany, and Italy. The is formed as such: Start with one at the top, then place the numbers below in a triangle formation, and add numbers as they combine, so you place two ones underneath, then place two ones on the sides again, but this time in the center they will add up to two. This pattern continues all the way down the triangle, which is infinite.
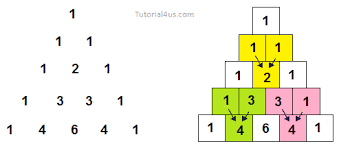
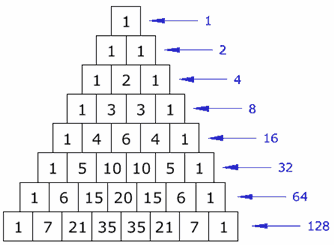
There are many patterns hidden within this triangle. For instance, if you write out the sums of the numbers in each row, you find the numbers double, starting with one, then two, then four, then eight, and so on. Also, if you look at the numbers formed by each row, you find that besides the top each are a multiple of eleven, This starts with 11(11 * 1), then 121(11*11), then 1331(11*121). This works all the way down the triangle, even with a row like 1, 5, 10, 10, 5, 1. Here, you carry over, resulting in the number 161,051(11 * 14641). This pattern is best seen with powers of 11, starting with 110

Another interesting thing is if you loom at the diagonals of this triangle. the sums of the numbers in the diagonals will give you the Fibonacci sequence. The diagonals in sequence also have things of interest, the first being ones, the second being counting numbers, the third being triangular numbers, and the fourth being square numbers.


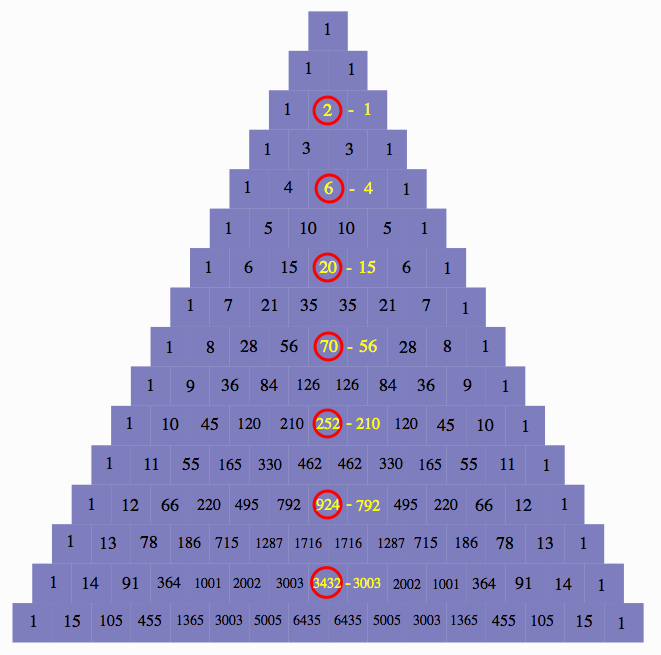
Another strange and interesting thing one can see in this triangle are the Catalan Numbers. The Catalan Numbers are taking shapes and finding out how many triangles it can be divided into by connecting vertices. In Pascal's triangle these numbers are found by taking the even numbers in the center of almost every other row and subtracting the number adjacent to it.

Finally (but not really) If you highlight every even number in Pascal's Triangle, you get a fractal that is essentially Sierpinski's Triangle.


Sources:
There are many patterns hidden within this triangle. For instance, if you write out the sums of the numbers in each row, you find the numbers double, starting with one, then two, then four, then eight, and so on. Also, if you look at the numbers formed by each row, you find that besides the top each are a multiple of eleven, This starts with 11(11 * 1), then 121(11*11), then 1331(11*121). This works all the way down the triangle, even with a row like 1, 5, 10, 10, 5, 1. Here, you carry over, resulting in the number 161,051(11 * 14641). This pattern is best seen with powers of 11, starting with 110


Another interesting thing is if you loom at the diagonals of this triangle. the sums of the numbers in the diagonals will give you the Fibonacci sequence. The diagonals in sequence also have things of interest, the first being ones, the second being counting numbers, the third being triangular numbers, and the fourth being square numbers.


Another strange and interesting thing one can see in this triangle are the Catalan Numbers. The Catalan Numbers are taking shapes and finding out how many triangles it can be divided into by connecting vertices. In Pascal's triangle these numbers are found by taking the even numbers in the center of almost every other row and subtracting the number adjacent to it.


Finally (but not really) If you highlight every even number in Pascal's Triangle, you get a fractal that is essentially Sierpinski's Triangle.

Sources:
Thursday, January 5, 2017
Math Jokes...Yeah
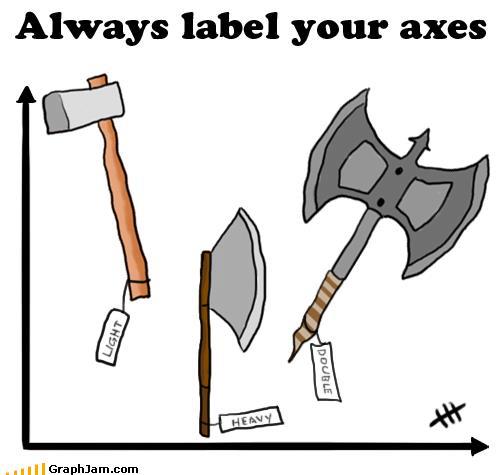
I post these nine math jokes because I am forced to. I am one of those people, but not in this particular situation. As I write this blog, I am laughing and crying at the same time. I am laughing because of the the math jokes, and I am crying because I'm laughing at math jokes
Hey, wanna hear a funny Joke? The grade I got on my math final.





Sources:
https://www.pinterest.com/cjlives/math-jokes/
http://imgur.com/gallery/YN1s5
http://meganpanagia.weebly.com/math-jokes.html
https://www.tes.com/lessons/JF047dHDorVKrw/math-funnies
https://www.pinterest.com/MissJacSimons/math-jokes/
https://www.pinterest.com/gaberobare/math/
https://www.pinterest.com/logarhythm12/math-jokes/
https://www.cazoommaths.com/maths-jokes/
Hey, wanna hear a funny Joke? The grade I got on my math final.


Sources:
https://www.pinterest.com/cjlives/math-jokes/
http://imgur.com/gallery/YN1s5
http://meganpanagia.weebly.com/math-jokes.html
https://www.tes.com/lessons/JF047dHDorVKrw/math-funnies
https://www.pinterest.com/MissJacSimons/math-jokes/
https://www.pinterest.com/gaberobare/math/
https://www.pinterest.com/logarhythm12/math-jokes/
https://www.cazoommaths.com/maths-jokes/
Thursday, November 10, 2016
Pick's Theorum
Recently, I was shown an amazing way to estimate the areas of shapes using something called Pick's Theorem. This theorem, created by George Alexander Pick in 1899, uses a plane with points each one unit apart, basically a Cartesian Plane in a different format, and doesn't require axes. This Theorem uses the number of points seen on the interior of a shape, and points seen on the edges of a shape. "i" represents interior, or lattice, points, and "b" represents edge, or boundary, points. The formula goes as follows: Area = i + (b/2) -1. There is also a version which incorporates interior spaces in the shape, which you can read about on this website. This theorem is especially useful for finding the areas of complicated shapes whose areas would be difficult to solve via rectification or by splitting the shape into several different shapes. Picks Theorem is also very similar to another method of estimating area, which uses a Cartesian Plane format with a grid rather than just points, in which you count the number of squares within a shape, and then count the number of squares divided or cut by the shape. Using Picks variables, "i" would be the interior squares, and "b" would be the boundary squares. By cutting the number of cut squares in half and adding that number to whole, interior squares, you can estimate the area of an object. The formula would be A = i + b/2. Below are some examples of shapes whose areas were estimated using both methods.


Other Method
A = 9 + ½13
A = 9 + 6.5
A = 15.5


Picks Theorem: Area = Lattice Points + (Boundary points/2)-1
Other Method: Area = Full Squares + Partial Squares/Two
Yellow Shape (Pick's)
A = 5 + (5/2) - 1
A = 15/2 - 1
A = 13/2
A = 6.5
Other method
A = 2 + (10/2)
A = 2 + 5
A = 7
Light blue shape
A = 2 + (9/2) -1
A = 13/2 -1
A = 11/2
A = 5.5
Other method
A = 0 + (11/2)
A = 5.5
Red Square
A = 0 + (4/2) -1
A = 2 -1
A = 1
Other method
A = 1 + (0/2)
A = 1
Hexagon
A = 4 + (6/2) -1
A = 4 + 3 -1
A = 6
Other method
A = 3 + 6/2
A = 3 + 3
A =6
Gray Triangle:
A =1+(3/2)-1
A = 3/2
A = 1.5
Other method
A = 0 + 4/2
A = 2
Second green triangle:
A = 0+(5/2)-1
A = 3/2
A = 1.5
Other Method
A = 0 +3/2
A = 1.5
Green shape(R):11+(11/2)-1=15 1/2=15.5
Figure A
A = 25 + (13/2) -1
A = 25 +6.5 -1
A = 31.5
Other Method
A = 22+½(14)
A = 22 + 7
A = 31
Figure Q
A = 10 + (12/2) - 1
A = 10 + 6 -1
A = 15
Other method
A = 7+½(14)
A = 7 + 7
A = 14
Figure R
A = 9 + 12/2
A = 9 + 6
A = 15Other Method
A = 9 + ½13
A = 9 + 6.5
A = 15.5
Monday, October 17, 2016
The Fourth Dimension
The fourth dimension is a very strange place for us to perceive. I believe it can be described quite well by this video Forget about your familiar world. But despite the simple explanations and mathematical reasons, I believe its pretty much impossible for us to image the fourth dimension. The process for imagining the fourth dimension is simple. You have a point in space. It has no dimension. You translate the point, and connect the two points with a line. That is the first dimension. You can then translate the line to get a plane or the second dimension, then translate again to get a three-dimensional shape, say a square. Translating the square gets you to the fourth dimension. We still only see this image in a three dimensional way though. As the video explains, we could only see the fourth dimension as an ever changing, three dimensional cross-section of the whole.
Imagine you are a two dimensional being. Also difficult, but probably easier than the fourth. Basically, you have less options for viewing the world and interacting with it. On a graph, you have two dimensions, and a location on the graph is represented by x and y, perpendicular to each other. Three dimensions adds z, perpendicular to x and y. A two d being would not be able to see z though, so a being from the third dimension would not necessarily be visible unless it passed through the origin of z, or the plane that the two dimensional being lives in. The two dimensional being would not be able to see the whole three dimensional being, but rather only what was passing through the origin of its z. We could visualize this as not seeing a hand, but rather only a cross section of a couple fingers.
My whole point in this is to allow us (or more honestly, me) to imagine seeing the fourth dimension. Basically, a four dimensional object or being would appear as an ever changing three dimensional shape, or if it stopped moving, a very confusing stationary three dimensional shape. Using the previous example, four dimensional beings may exist in vast numbers, but never bother to pass through our plane of existence.
Monday, October 3, 2016
Grade of the Road
I
always wondered about those strange signs, such as the ones you see on a New Mexico
highway rolling over steep hills with a black semi-truck going down a black triangle,
reading 6%. I never managed to piece it together, although I never gave it much
thought. It is simple enough to look such things up on the internet, so why not.
It turns out grade is a simple rise over run calculation. For example, if you
go a horizontal distance on a mountain highway of 100 feet, and you rise 25 feet,
then your calculation is 25 feet divided 100 feet, which is equal to 0.25 (the
feet cancel). You then times this number by 100, getting 25% grade, percent
being out of a hundred. This is exactly like calculating the slope of a line on
a graph, using its rise over run, except grade is represented as a percentage
rather than a fraction or whole number.
You can do more using the method of calculating the grade of a road. The horizontal distance can be seen as the base of a right triangle, and the vertical distance as the height. This makes a right triangle, which gives you the ability to solve for many things. For instance, you can solve for distance traveled (The hypotenuse) using the Pythagorean Theorem, which using our example would be calculating out 25 squared plus 100 squared, which is equal to c squared, which comes out to be about 103 feet, or more precisely 25 times the square root 17. You can also solve for the angle of the road, using trigonometry. Tangent is a ratio used for finding out the side opposite an angle and an adjacent side in a right triangle. If we use this equation, we can solve for the angle the road is tilting, in this case Tan (tangent) of x° is equal to 25 feet divided by 100 feet. You can’t divide by tangent to find x, however, so you must use the Inverse Tangent to solve for the angle, or the Inverse Tangent of 25 feet divided by 100 feet (0.25), which is about 14. Therefore, the angle of the road is about 14°. This could be very helpful for people to understand how steep the road they are driving on is, since a 25% grade would be difficult to see.
Subscribe to:
Posts (Atom)


